
Welcome to my weekly market outlook series, where I will analyse the critical financial indicators that shape market behaviour and economic trends. Each week, we’ll explore key data such as US treasury par rates, yield curves, and their slopes—vital tools in understanding the direction of interest rates and market sentiment (inspired by Mark Meldrum). I’ll also keep you updated on important events like FOMC/MPC meetings, UK inflation reports, and UK employment figures, as well as how these impact monetary policy decisions.
Stay tuned as we interpret the numbers and uncover what they mean for investors and the broader economy.
Welcome to This Week’s Market Outlook
This week’s market outlook will serve as a tutorial to elucidate the methodology I will employ on a weekly basis. We will conduct a thorough analysis to comprehend the significance of the figures and graphs, as well as their importance in the context of market analysis. The tutorial will commence with an examination of par rates, the yield curve, and relevant slopes concerning key rates.
Par Rates
A par rate refers to the coupon rate that a treasury security would possess if it were traded at par value. Par rates are significant for several reasons:
- Firstly, they establish the risk-free rate. The risk-free rate represents the interest rate that investors can anticipate earning from a risk-free investment, such as treasury bonds. Additionally, the risk-free rate plays a crucial role in the pricing of financial instruments and in determining appropriate rates of return for various investment strategies.
- Par rates also play a crucial role in the assessment of risk. By comparing the par rates of bonds with varying maturities, investors are able to evaluate risk premiums, liquidity risks, and market expectations regarding interest rates.
- Furthermore, from the par rates, it is possible to compute the spot rates using a methodology known as bootstrapping. Subsequently, the spot rates allow for the calculation of forward rates.
Having established an understanding of par rates and their significance, we shall proceed to examine the methodology that will be employed weekly to analyse these par rates, the par curve, and the key slopes associated with the data.
The methodology will commence with a thorough examination of the figure presented below. The initial table offers the par rates corresponding to each key date. It includes par rates from the beginning of the year, the rates recorded from the previous week, and those observed today (A). Additionally, two rows have been included to denote the weekly changes for each rate and the year-to-date changes pertaining to these par rates.
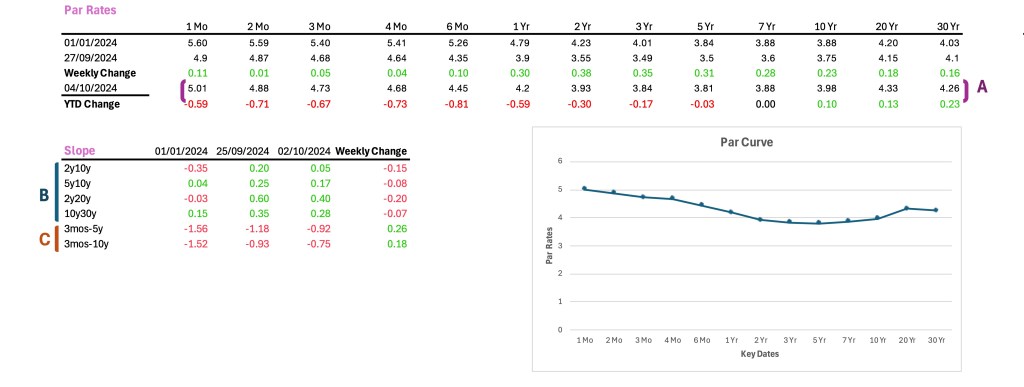
Subsequently, we shall utilize the par values observed today to construct our par curve, which will be further examined during our market outlook.
The slope figures displayed at the lower left corner of the illustration are crucial for interpreting interest rate environments and additionally act as potential early indicators of economic slowdowns or recessions. Comprehending these movements is essential for predicting changes in market dynamics and economic cycles.
The initial four rows of the slope table, as depicted by (B), signify the capital-market slope. Conversely, the subsequent two slopes, illustrated by (C), denote the capital-market-to-money-market slopes.
When the slope figures are negative, this signifies a slope inversion. These figures hold significant importance because empirical evidence indicates that prior to every recession, there has been a capital market inversion. However, it is crucial to acknowledge that not every capital market inversion has resulted in a recession. Additionally, it has been observed that before each recession, there has been a capital-market-to-money-market inversion. It is also noteworthy that every capital-market-to-money-market inversion has indeed led to a recession. Inversions can be quantified by the product of Duration and Depth (D*D). The greater the duration and depth of the inversion, the higher the probability of a forthcoming recession.
For this reason and others that will be discussed subsequently, we will dedicate our efforts to investigating the capital market slopes as well as the capital-market-to-money-market slopes.
UK Inflation
Prior to delving into the methodology that will be employed to assess and extrapolate the inflationary environment in the United Kingdom, it is essential to comprehend the concept of inflation, its underlying causes, how it is measured, and its implications for the broader economy.
Definition
Inflation refers to a broad rise in the prices of goods and services across the economy over time, eroding purchasing power for both consumers and businesses.
Underlying Causes of Inflation
In the long term, monetary policy serves as a crucial determinant of inflation. Monetary policy encompasses a series of actions that central banks can undertake to regulate the money supply within the economy and manage borrowing costs. The primary objective of monetary policy is to maintain low and stable prices, thereby reducing inflation. The two principal monetary policy instruments employed by central banks to achieve this objective of low inflation are interest rates and the money supply, particularly through quantitative easing.
- Interest Rates
In the event that the economy exhibits signs of overheating and inflation escalates to an undesirable level, the central bank may opt to raise interest rates. Such an increase in interest rates imposed by the central bank renders borrowing more costly for both consumers and businesses. Consequently, this surge in borrowing costs leads to a reduction in spending and investment, ultimately diminishing the demand for goods and services. As demand wanes, businesses experience diminished pressure to elevate prices, thereby contributing to the alleviation of inflationary pressures.
Conversely, during periods of economic downturn, central banks frequently reduce interest rates as a means to stimulate economic activity. When a central bank decreases interest rates, the cost of borrowing diminishes, thereby encouraging both consumers and businesses to increase their spending and investment. This rise in expenditure enhances demand for goods and services, potentially resulting in elevated prices (inflation), particularly if the supply of goods fails to meet the growing demand. Therefore, the central bank must exercise caution, as this scenario may precipitate a rise in inflation should demand surge too rapidly.
- Money Supply
Through the acquisition of government bonds, a procedure referred to as quantitative easing, the central bank injects liquidity into the economy, resulting in an increase in the volume of money circulating. An augmented money supply may enhance consumer and business expenditures, consequently elevating demand, which may lead to escalated inflation should supply fail to keep pace.
Conversely, the central bank possesses the capability to withdraw liquidity from the economy through the sale of government bonds or the implementation of higher reserve requirements for banking institutions. A reduced money supply results in diminished spending and demand, which may contribute to a decrease in inflation.
We now turn our attention to short-term causes/types of inflation, Demand-pull inflation and Cost-push inflation.
- Demand-Pull Inflation
This situation arises when the total demand for goods and services surpasses the economy’s supply capacity, resulting in increased prices. This form of inflation occurs when consumers, businesses, and the government boost their spending, elevating demand. However, the supply of goods and services does not keep pace with this rising demand. Consequently, producers increase prices to equilibrate the excess demand.
- Cost-Push Inflation
This happens when overall price levels increase in an economy because production costs rise. These increased costs are transferred to consumers through higher prices for goods and services. Such inflation occurs when the supply side of the economy experiences rising costs, which may involve raw materials, wages, energy prices, or taxes, prompting businesses to increase prices to protect their profit margins.
Having looked at the underlying causes of inflation, both short and long-term, we turn our attention to how inflation is measured.
How Is Inflation Measured?
In the UK, inflation is primarily measured through price indices that track changes in the cost of a basket of goods and services over time.
The Consumer Price Index (CPI) tracks the changes in the price of a basket of goods and services typically purchased by households. It covers a wide range of items, including food, clothing, housing costs (excluding mortgage interest payments), utilities, transportation, healthcare, and entertainment.
Each month, the Office for National Statistics (ONS) collects data on the prices of thousands of goods and services from various retailers, businesses, and service providers across the UK. These items include everyday essentials such as food and drink, clothing, transport, energy bills, and leisure activities. The range of goods and services in the basket is reviewed regularly to ensure it reflects the latest spending habits of UK consumers.
Each item in the basket is assigned a weight based on its importance to household spending. For example, if the average household spends more on transportation than on clothing, transportation will have a higher weight in the index. These weights ensure that changes in the prices of more significant items have a bigger impact on the overall CPI than less significant ones.
Once the prices are gathered and the weights are applied, the ONS compares the current prices to those from a base period, calculating how much prices have changed. This percentage change is the rate of inflation for the period. If the CPI shows a rise of 2%, it means the average price of the goods and services in the basket has increased by 2% compared to the base period.
In summary, the CPI provides a clear view of price changes in the economy, helping governments, businesses, and consumers make informed financial decisions.
Inflation’s Impact on the Economy
Inflation possesses the capability to yield both advantageous and adverse consequences. Moderate inflation is frequently perceived as an indicator of a growing economy, stimulating consumption and investment activities. Conversely, elevated or hyperinflation can diminish the value of savings, disrupt business planning, and engender economic instability.
Furthermore, although low inflation may present some immediate benefits, such as stable prices and enhanced purchasing power, excessively low inflation can indicate economic stagnation, amplify the real burden of debt, and result in sluggish wage growth. In extreme scenarios, it may precipitate deflation, which is typically more detrimental than moderate inflation, as it discourages consumer spending and investment initiatives.
Central banks, including the Bank of England, strive for moderate inflation (approximately 2%) as it achieves a balance between circumventing both excessive inflation and the potential risks associated with insufficient inflation or deflation.
Methodology
Having elucidated the concept of inflation, its fundamental causes, the methodologies employed for measurement, and its repercussions on the economy, I believe we are adequately prepared to introduce the methodology that I will be implementing on a weekly basis to analyse and interpret inflation data.
- Introduction
The market outlook will begin with an introduction briefly explaining the purpose of the report. We will then move on to the key highlights, where we will summarise the most important findings, such as inflation trends or key drivers affecting inflation over the past week.
- Overview of Current Inflation Data
As the reports on the Consumer Price Index (CPI) are disseminated monthly, this segment of our outlook will be published monthly as well. We will commence with a line chart that illustrates the CPI inflation rate in the United Kingdom over the preceding twelve months, highlighting the most recent data point.
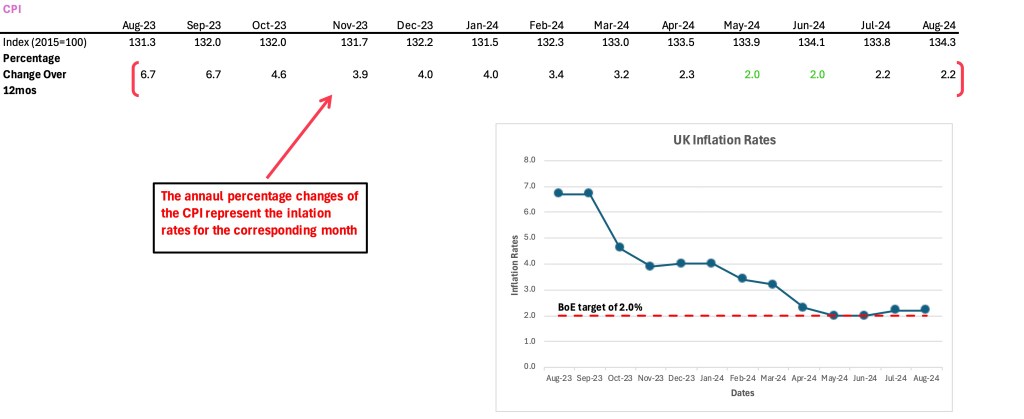
We shall also allocate time to analyse the recent data and compare it to previous months while identifying any trends, including rising, falling, or stable inflation.
- Key Drivers of Inflation
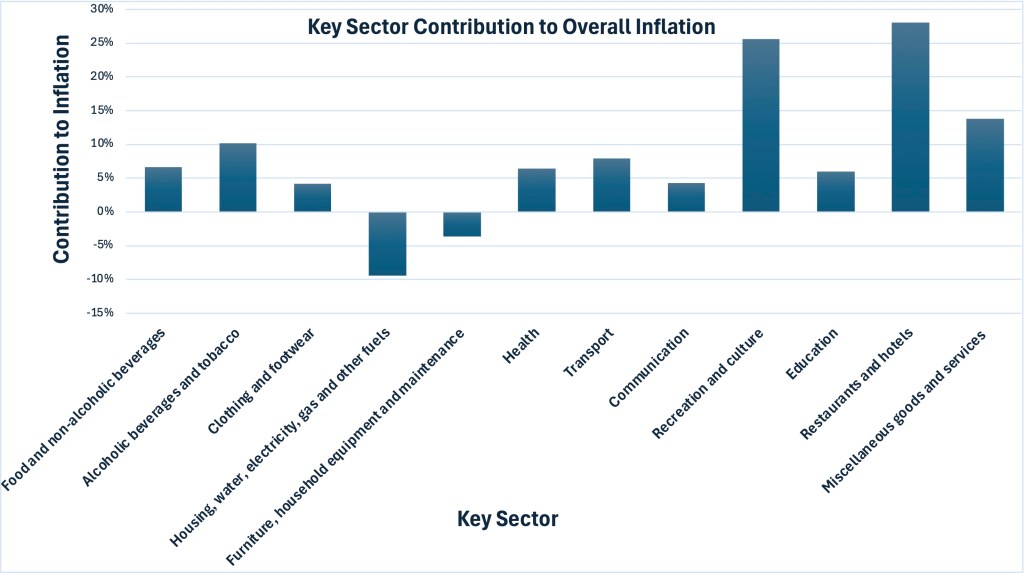
The inclusion of key drivers of inflation in our weekly UK inflation report offers valuable insights into the reasons behind fluctuations in inflation and the potential future trajectory. This analysis will focus on energy prices, including oil, gas, and electricity, as well as food prices, examining their influence and contribution to inflationary trends. Furthermore, we will assess any disruptions in supply chains and their resultant impact on market prices.
We shall also construct a bar chart illustrating the relative contributions of key sectors (e.g., energy, food, services, etc.) to overall inflation and analyse which components are influencing inflation either upwards or downwards.
- Wage Growth and Inflation
In this section of our report, we will present United Kingdom employment data statistics and examine the wage-price relationship.
We will analyse the influence of capital-deepening investments and technological advancements in the United Kingdom on unemployment rates and labour productivity.
Moreover, we will investigate the correlation between wage growth and CPI inflation.
To enhance our understanding of these two variables, we will incorporate a dual-axis line chart depicting inflation rates in comparison to wage growth over a specified period.
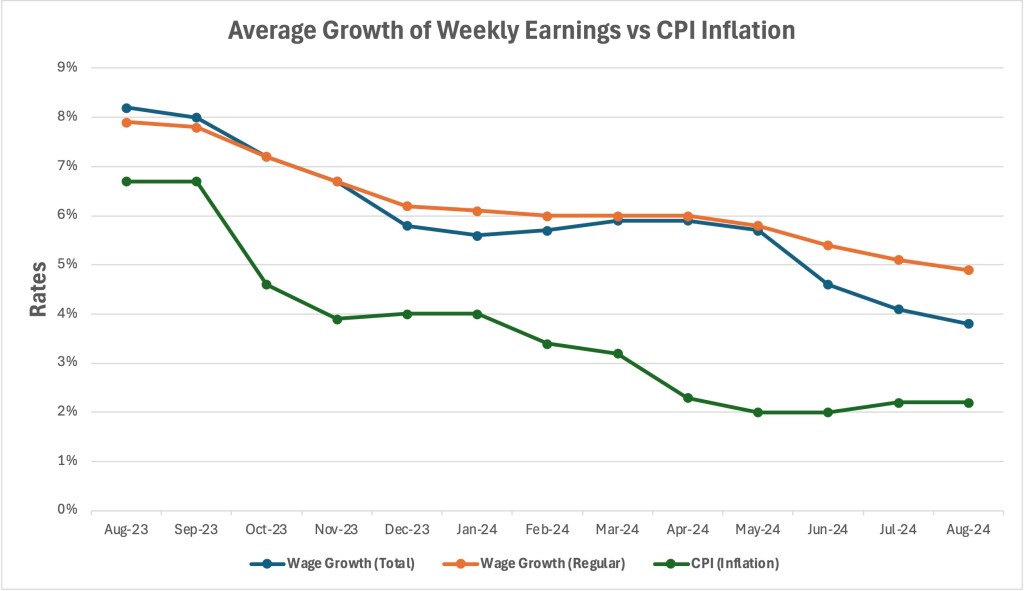
We shall conclude this section by evaluating whether rising wages are contributing to inflationary pressures, and what it means for the overall economy.
- Monetary Policy Response
Subsequently, we will integrate the Monetary Policy Response into our weekly inflation report. The Bank of England (BoE) modifies interest rates and employs various monetary policy instruments to regulate inflation. Monitoring these determinations provides valuable insights into potential fluctuations in inflation over time, which is essential for forecasting inflationary trends.
Furthermore, this monitoring presents an opportunity to analyse any policy modifications that may influence bond yields and stock market dynamics as they reshape expectations regarding economic growth and stability.
- Outlook for Next Week
In this section, we shall analyse our anticipated outlook concerning inflation through the utilization of short-term projections, thereby providing a forecast for inflation in the forthcoming weeks grounded in prevailing data trends.
Additionally, we will emphasize any emerging risks that may influence inflation in the near term, such as geopolitical tensions and weather disruptions impacting agriculture. These evaluations will be utilized to construct a line graph depicting potential inflation rates over the forthcoming weeks or months.
We will finalize this section by analysing the probability of various inflation scenarios, including a continued increase, stabilization, or decline.
- Conclusion
In conclusion of our comprehensive inflation report, we will summarise the key points derived from the analysis and present a conclusive remark regarding the overall outlook on inflation. Additionally, we will examine the implications of the prevailing inflation trends for businesses, consumers, and policymakers.
Economic Calendar
The final segment of our Market Outlook will focus on the economic calendar, which will present an overview of imminent data releases, central bank meetings, and other significant economic events that may influence market dynamics.
We will identify the most impactful events, such as inflation reports, Gross Domestic Product (GDP) figures, and central bank meetings. For each prominent event, we will offer a concise overview comparing market expectations to potential outcomes. This approach is designed to assist the audience in comprehending prevailing consensus predictions and preparing for any unexpected developments.The calendar format will ensure that readers remain informed and equipped for the economic influences of the week, thereby rendering this outlook both actionable and comprehensive.
Conclusion
Thank you for sticking with me to the end of this market outlook tutorial! I hope this titorial has given you valuable insights into the complex dynamics of today’s market landscape. Your time and attention mean a lot, and I’m glad you chose to explore these trends with me. As always, the market is constantly evolving, and staying informed is the key to making smarter decisions. Be sure to keep an eye out for our next post, where I’ll continue to break down the latest developments and what they mean for you. Until then, stay curious, stay informed, and thanks for reading!

Leave a comment