
Welcome to our first market outlook session. Today, we’ll dive into an essential analysis of three fundamental economic indicators that significantly influence the present financial landscape: par rates, inflation, and unemployment. Each of these metrics offers valuable insights into market sentiment, economic health, and prospective policy directions, thereby providing a robust foundation for comprehending potential investment opportunities and associated risks.
First, we’ll start by analysing par rates, which represent the prevailing interest rate environment and serve as a vital component in bond pricing and the evaluation of fixed-income investments. By examining the term structure of interest rates, we can ascertain investor expectations regarding the economy’s short-term trajectory and detect changes that may indicate either potential opportunities or risks.
Subsequently, we will conduct an analysis of inflation, a consistently influential element affecting purchasing power, consumer demand, and monetary policy. Gaining an understanding of inflationary trends enables us to predict prospective adjustments in interest rates by central banks, which carry significant implications for both short-term and long-term investment strategies.
Lastly, we’ll review unemployment rates, which provide insight into the health of the labour market and the broader economy. Employment levels influence both consumer spending and inflation pressures, making them an essential component in our market outlook. Analysing recent unemployment data will help us assess the sustainability of current growth trends and potential vulnerabilities in the economy.
Through the examination of these three areas, we may cultivate a nuanced understanding of the present state of the market and construct a more informed perspective regarding potential future developments. We shall commence with an analysis of par rates.
Par Rates
Before we dive into this week’s United States Treasury par rates, it is important to review the definition of par rates and to understand their significance.
The par rate represents the interest rate at which a bond or debt instrument is priced at its face value, indicating the absence of either a premium or discount. Par rates provide essential insights into market expectations, investor behaviour, and the overall state of the financial market, acting as a barometer for interest rates and market conditions. By comparing the par rate to current market rates, financial analysts can gauge investor sentiment and expectations regarding future interest rates, economic conditions, and inflationary trends.
For instance, when market interest rates exceed par rates, this signifies that investors expect stronger economic growth or an increase in inflation. Such expectations typically lead to higher yields on newly issued bonds in order to compensate for the projected decline in the purchasing power of the bond.
Conversely, when market interest rates fall below par rates, it indicates that investors are bracing for slower economic growth or reduced inflation, which may result in lower yields on bonds as demand for safer investment vehicles rises. This dynamic directly reflects broader economic trends, rendering par rates an instrumental tool for analysing current market conditions.
After having addressed the definition and significance of par rates, we shall now proceed to our analysis of the par rates for bonds issued by the United States Treasury.
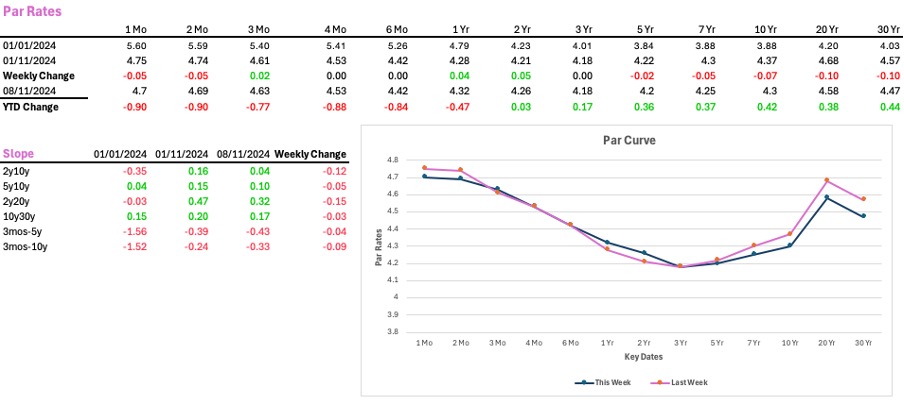
The figure presented above illustrates the United States Treasury par rates for the respective key dates. One aspect that is immediately discernible from our graph is the inverted par curve, wherein short-term rates surpass long-term rates. This phenomenon is generally concerning, as it is perceived as an indication of a potential forthcoming recession.
An inverted par curve is frequently interpreted as an indicator of an impending recession, as it signifies widespread pessimism regarding the future growth prospects of the economy. This inversion disturbs the conventional yield curve configuration, wherein long-term interest rates typically exceed short-term rates, and suggests that investors anticipate a decline in economic conditions. The following outlines the rationale for the perception of an inverted par curve as a recessionary signal indicator:
- Investor Expectations of Slower Economic Growth
Normally, investors require higher returns on long-term bonds to compensate for the uncertainty of holding these securities over time. However, when the par curve inverts, it indicates that investors are shifting their expectations towards lower future growth and possibly lower inflation. This change in outlook typically occurs when investors believe the economy is heading toward a slowdown or recession, prompting them to buy long-term Treasuries for safety. - Flight to Safety and Demand for Long-Term Bonds
During periods of economic uncertainty, investors tend to favour safer, longer-term bonds. Increased demand for these securities drives their prices up, which in turn pushes yields down (since bond prices and yields move inversely). As more investors flock to long-term bonds, long-term yields fall, even below short-term rates, causing the inversion. This “flight to safety” is driven by the perception that other investments (such as equities or corporate bonds) may be riskier in a potentially weakening economy. - Implications for Borrowing and Spending
An inverted curve impacts banks and lenders, whose profitability relies on the spread between short-term borrowing rates (which they pay) and long-term lending rates (which they receive on loans). When the curve inverts, lending becomes less profitable, leading banks to tighten lending standards. Reduced lending impacts consumer spending and business investment, which are essential drivers of economic growth. When these decrease, the economy can contract, further increasing the likelihood of a recession.
Having broken down what an inverted par curve and its implications concerning economic sentiment, we shall now direct our attention to the slope figures illustrated in the figure above.
The initial four slope figures illustrate the capital market slopes. If we look under the column dated November 8th, one observes that all figures exhibit positive values. This indicates the presence of an upward-sloping capital market slope. Such an upward-sloping curve is commonly referred to as a “normal” curve and typically signifies positive expectations regarding economic growth, moderate inflation, and a stable, healthy economic environment.
The last two slope figures illustrate the capital-market-to-money-market slopes. In contrast, these slopes exhibit negative values, indicative of an inverted curve. An inverted slope between the capital market and the money market generally signifies investor apprehensions regarding a potential economic slowdown or recession. It indicates a pronounced preference for long-term, safer investments over short-term securities, as well as an anticipation that central banks may need to reduce interest rates in response to deteriorating economic conditions.
Now that we have explained the figure above and the implications of the associated numbers and graphs for the economy, it is also imperative to comprehend the pathway that led us to this point.
What Caused the Par Curve Inversion?
It is important to recall that a “normal” yield curve is upward-sloping, with long-term bonds exhibiting higher interest rates. The inversion of the United States par curve, where short-term Treasury rates have risen above long-term Treasury rates, has been driven by a combination of economic factors, central bank actions, and shifting market expectations.
The graph presented below illustrates the changes in the shape of the par curve on an annual basis, commencing from the end of 2021, through the end of 2022, continuing to the end of 2023, and concluding with the data from this week.
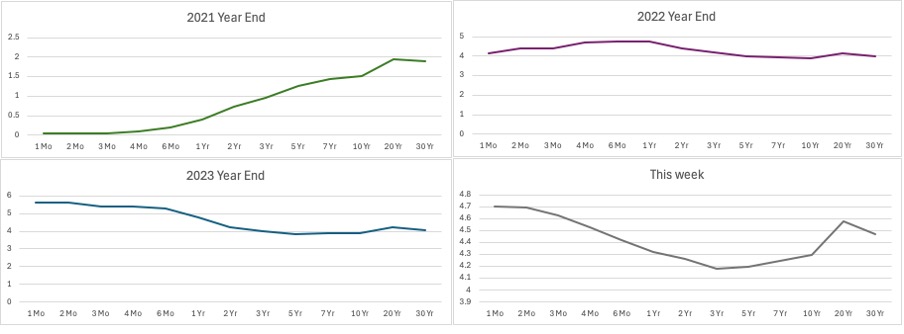
Following the presentation of a graphical representation illustrating the “normal” par curve as of the end of 2021 and the subsequent progression to an inverted curve, we now seek to analyse several of the primary factors that have contributed to the yield curve inversion:
- Federal Reserve’s Tight Monetary Policy
The United States Federal Reserve has implemented substantial increases in short-term interest rates as a measure to address elevated inflation levels. Commencing in the year 2022, the Federal Reserve initiated an assertive cycle of rate increases, elevating the federal funds rate on multiple occasions. This policy directly affects short-term interest rates, resulting in their significant rise. The primary objective of this policy is to cool down demand within the economy and restore inflation to the Federal Reserve’s target level, which is typically approximately 2%. Consequently, short-term interest rates have climbed sharply, reflecting the Fed’s tightening stance.
During periods of tightening monetary policy, wherein a central banking institution, such as the Federal Reserve, increases short-term interest rates to mitigate inflationary pressures or cool down an overheated economy, a specific form of yield curve movement occurs.
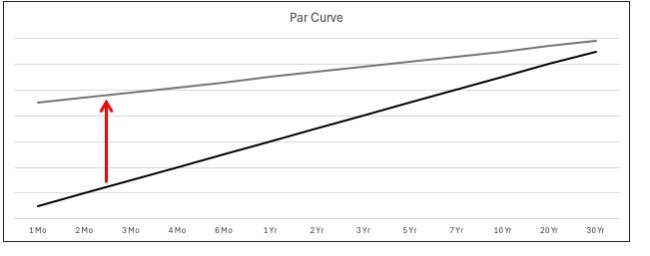
This phenomenon is characterised by the increase of short-term interest rates at a faster rate than that of long-term interest rates, resulting in the flattening of the yield curve. This occurrence is denoted as a bear flattener.
- High Inflation and Inflation Expectations
The elevated inflation experienced in the United States, attributable to factors such as supply chain disruptions, volatility in energy prices, and a rise in consumer demand following the pandemic, has compelled the Federal Reserve to adopt a more hawkish monetary stance. Despite the emergence of certain indicators suggesting a moderation in inflation, persistent concerns linger regarding the potential for ongoing inflationary pressures. Consequently, short-term interest rates remain elevated, as market expectations predict that the Federal Reserve will sustain a restrictive policy for an extended duration to ensure effective control of inflation.
- Impact of Quantitative Tightening (QT)
The Federal Reserve has been implementing Quantitative Tightening (QT), a process that entails the reduction of its balance sheet through the non-reinvestment of proceeds from maturing bonds. This strategic action effectively diminishes liquidity within the financial system, consequently exerting upward pressure on short-term interest rates. As liquidity is withdrawn, the costs associated with short-term borrowing escalate, further contributing to the upward pressure on short-term yields.
These factors, among various others, have contributed to our current unfavourable situation regarding the inverted par curve. We shall now direct our focus towards the interventions that have been implemented to rectify the curve, as well as consider additional measures that could be adopted by the Federal Reserve to address the issue of the inverted par curve.
Measures to Rectify the Inverted Par Curve
In 2024, the Federal Reserve has implemented a series of measures designed to rectify the inverted yield curve. Presented below is an overview of several strategies and actions that the Federal Reserve has undertaken to address this inversion:
- Adjustment of the Federal Funds Rate
One of the primary tools the Federal Reserve uses to influence the economy is the adjustment of the federal funds rate. The federal funds rate is the interest rate at which depository institutions (such as banks and credit unions) lend reserve balances to other depository institutions overnight. These reserve balances are funds held at the Federal Reserve to meet the reserve requirements set by the central bank.
The Federal Reserve, specifically the Federal Open Market Committee (FOMC), sets a target range for the federal funds rate. Instead of a single number, it’s often expressed as a range (e.g., 5.25% to 5.50%). The FOMC meets approximately every six weeks to review economic conditions and decide whether to adjust this target range.
In an effort to correct the inverted yield curve, the Federal Reserve initiated a series of targeted rate cuts. These cuts were aimed at lowering short-term interest rates to bring them in closer alignment with longer-term rates. A reduction in the federal funds rate lowers borrowing costs across the economy, stimulating economic activity and potentially leading to higher long-term yields as economic growth expectations improve.
The Fed has been careful about the timing and magnitude of rate adjustments. Instead of making abrupt, large cuts, the Fed has opted for more gradual and smaller rate reductions to avoid signalling panic or creating excessive market volatility. This approach aims to manage market expectations and ensure that any rate adjustment is perceived as a measured and data-driven response. - Forward Guidance
Another instrumental tool employed by the Federal Reserve is forward guidance, which entails the communication of the anticipated trajectory of monetary policy to the public and the financial markets. In the year 2024, the Federal Reserve has implemented several measures to deliver clearer guidance, including a commitment to sustaining lower interest rates for an extended duration until definitive indicators of economic recovery and inflation stabilization manifest. Furthermore, it has increased its transparency concerning its decision-making processes by routinely updating its economic projections and engaging in open discussions regarding the key metrics that it monitors. - Quantitative Easing (QE) and Balance Sheet Adjustments
The Federal Reserve has also resumed Quantitative Easing (QE) in response to the inverted yield curve. This process involves the acquisition of longer-term government bonds and mortgage-backed securities with the aim of directly influencing longer-term interest rates. Additionally, the Federal Reserve has permitted some of its short-term holdings to mature without reinvestment. This strategic approach can exert upward pressure on short-term rates and enhance the slope of the yield curve.
These measures, particularly the rate cuts, have significantly contributed to a decrease in the extent of yield curve inversion by exerting a greater influence on short-term rates compared to long-term rates, which are more susceptible to broader economic conditions and market expectations. The observed narrowing of the inversion by late 2024 indicates progress; however, it should be noted that the curve has not yet attained full normalisation, as indicated by our first figure above.
Conclusion
In concluding the “Par Rate” section of our market outlook, it is evident that comprehending shifts in par rates extends beyond the mere tracking of bond yield trajectories. It necessitates an in-depth examination of how market expectations regarding future interest rates, investor sentiment, and liquidity preferences converge to influence the yield curve’s behaviour. By integrating the fundamental principles of bond valuation with the broader macroeconomic context, we can ascertain how par rates offer essential insights into market dynamics and economic health. As we continue to navigate an ever-evolving financial landscape, the par rate remains a crucial barometer, providing a nuanced snapshot of both current conditions and anticipatory expectations.
Inflation
Prior to delving into our inflation outlook, it is essential to comprehend the precise definition of inflation. Inflation refers to the rate at which the overall price level of goods and services increases, resulting in a reduction in the purchasing power of currency. In more straightforward terms, when inflation materializes, each unit of currency acquires fewer goods and services, indicating a decline in the value of money over time.
Having clarified the definition, we are now prepared to delve into our inflation outlook.
Introduction
As inflation continues to shape the economic landscape, staying ahead of price trends is more crucial than ever. This week’s Inflation Outlook dives deep into the forces driving changes in the cost of living, from shifts in global supply chains to domestic spending habits and central bank policies. We’ll explore the latest data on consumer prices, uncover emerging trends, and forecast what lies ahead for businesses, investors, and everyday consumers. Whether you’re watching food prices, energy costs, or interest rates, our weekly analysis will help you navigate the complex world of inflation with clarity and insight.
Overview of Current Inflation Data
We begin our overview of current inflation data by conducting a trend analysis of the CPI inflation rate over the last 12 months.
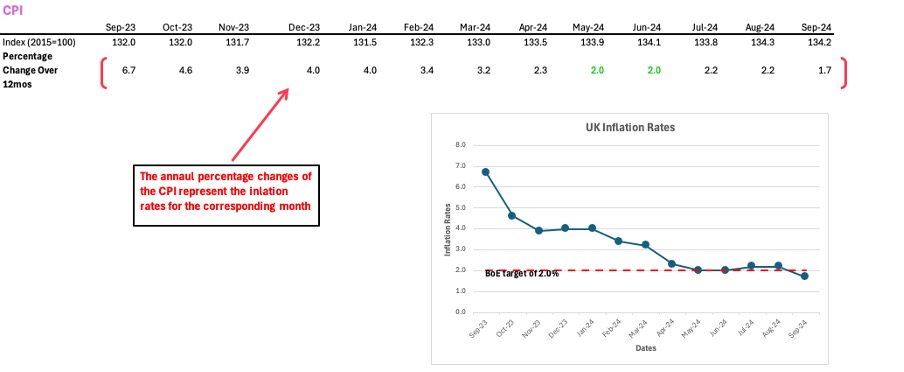
Upon examination of the graphical representation above, it is apparent that inflation decreased from 6.7% in September 2023 to 1.7% in September 2024, thereby aligning more closely with the Bank of England’s targeted rate.
The elevated inflation rates observed in 2023 were attributed to a multitude of factors, including:
- High Energy Costs
Energy prices constituted a significant factor contributing to inflation within the UK. Following the conflict in Ukraine and the ensuing geopolitical tensions, Europe encountered substantial disruptions to its energy supply. The United Kingdom, which relies heavily on imported natural gas, saw sharp increases in wholesale gas prices, resulting in elevated energy bills for households.
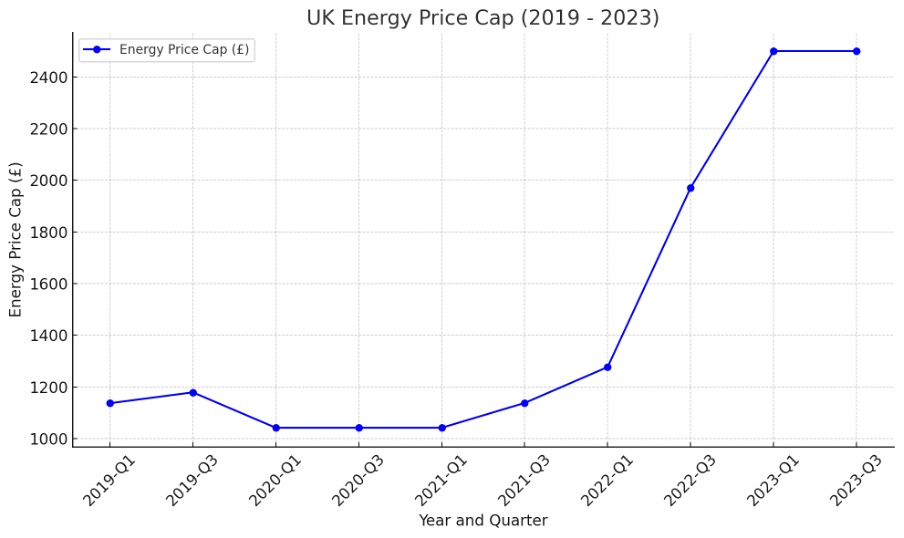
Moreover, the energy price cap in the United Kingdom, which regulates the maximum allowable charges by energy suppliers, has been incrementally raised to accommodate the increased costs. The figure presented below illustrates that, in 2023, the energy price cap increased to £2500 between the first and third quarters. This figure indicates costs that are considerably higher than levels observed prior to the COVID-19 pandemic. These modifications have directly influenced household expenses and have played a substantial role in contributing to inflation.
- Food and Beverage Costs
The rise in input costs for agricultural producers, encompassing fertilizer, feed, and energy, has resulted in heightened expenses associated with food production. These increased costs have ultimately been transferred to consumers, resulting in elevated prices across a wide array of food products. For example, by September 2023, the prices of food items had risen by more than 12% in comparison to the previous year, signifying one of the steepest rises in decades.
Furthermore, the enduring repercussions of the COVID-19 pandemic, in conjunction with the disruptions stemming from the conflict in Ukraine, have adversely affected global food supplies, particularly concerning grains and oils. Consequently, this situation has precipitated notable price surges in essential food commodities.
- Weak Pound Sterling
A weaker British pound has resulted in an increase in the cost of imported goods, which has further exacerbated inflation. A decline in investor confidence, coupled with economic uncertainty stemming from political instability and adjustments related to Brexit, has exerted downward pressure on the pound.
Throughout a significant portion of 2023, the pound had traded below $1.30 against the U.S. dollar, reflecting a depreciation from pre-pandemic levels. This depreciation has rendered imported goods, particularly food, fuel, and raw materials, more costly, thus contributing to elevated production costs domestically. It is estimated that import costs have contributed an additional 1-2% to overall inflation throughout the year 2023.
As time progressed towards the conclusion of 2024, the inflation rates experienced a substantial decline, approaching the Bank of England’s target of 2%. This marked decrease in inflation rates from 2023 to 2024 can be attributed to several critical factors, including:
- Energy Prices Decline
The easing of energy prices significantly contributed to the reduction of inflation. Energy expenses, which experienced a significant increase in 2022 as a consequence of the Ukraine conflict, commenced stabilization as global supply chains adjusted. By early 2024, energy prices were no longer exerting the same inflationary pressure as they had during the peak period, which resulted in the Consumer Price Index (CPI) inflation surpassing 11%. - Monetary Policy
The Bank of England’s aggressive response, with a succession of interest rate increases from 2021 to 2023, constituted a significant factor. By 2023, the interest rates had ascended to 5.25%, marking the highest level since 2008. These increments in interest rates were intended to mitigate consumer expenditure and decrease demand, which subsequently contributed to a deceleration in price increases. Consequently, by September 2024, inflation had diminished closer to the Bank’s target of 2%. - Global Supply Chain Adjustments
Improvements in global supply chains, recovery following the pandemic, and modifications addressing supply disruptions stemming from geopolitical tensions have collectively contributed to the alleviation of price pressures. The normalization of supply, especially concerning food and other essential commodities, facilitated a decrease in cost-push inflation, a notable factor behind the price increases observed in previous years.
As we conclude this week’s overview of inflation, it becomes apparent that the economic landscape of the United Kingdom is achieving a more stable foundation. The notable decline in inflation from the peaks observed in the previous year highlights the synergistic effects of diminishing energy prices, effective monetary policy initiatives, and a gradual normalization of supply chains. Nevertheless, the journey is far from complete—although inflation has decelerated, elevated prices have become the new standard, resulting in continued pressure on consumer purchasing power.
Looking forward, the equilibrium between fostering economic growth and maintaining inflationary control will remain a pivotal concern for policymakers, businesses, and investors alike. As the economy of the United Kingdom undergoes recalibration, maintaining vigilance regarding inflationary trends will be imperative for facilitating informed market decisions.
Unemployment…
Collecting data… This portion of the outlook will be completed ASAP.
Economic Calendar
For the week of November 10 to November 17, 2024, here are key economic events to watch in both the UK and the US:
United Kingdom Economic Calendar
Monday, November 11, 2024
- UK GDP Monthly Estimate (September): An important measure of the UK’s economic performance, indicating how the economy is growing or contracting.
- UK Industrial and Manufacturing Production (September): Provides insights into the performance of the industrial sector, including manufacturing, mining, and utilities.
- UK Trade Balance (September): Tracks the difference between exports and imports of goods and services, giving a sense of the UK’s trade health.
Tuesday, November 12, 2024
- UK Unemployment Rate (September): Provides an overview of the UK labour market and the percentage of unemployed workers.
Wednesday, November 13, 2024
- UK Inflation Rate (CPI) (October): Measures the change in prices paid by consumers, a key indicator for understanding inflation trends.
- UK Core Inflation Rate (October): Similar to CPI but excludes more volatile items like food and energy to show underlying inflation trends.
- UK Producer Price Index (PPI) (October): Gives insights into the average changes in prices received by domestic producers for their output.
Friday, November 15, 2024
- UK Retail Sales (October): Measures the total value of retail sales, indicating consumer spending trends.
- GfK Consumer Confidence (November): A survey-based indicator reflecting consumer sentiment and economic expectations.
United States Economic Calendar
Tuesday, November 12, 2024
- NFIB Small Business Optimism Index (October): Reflects the outlook of small businesses, indicating overall confidence in economic conditions.
Wednesday, November 13, 2024
- US Consumer Price Index (CPI) (October): One of the most crucial indicators for inflation, showing changes in consumer prices.
- US Core CPI (October): Excludes food and energy for a clearer inflation trend.
- US Crude Oil Inventories: Weekly update on crude oil stocks, which can influence oil prices and provide insights into energy demand.
Thursday, November 14, 2024
- US Producer Price Index (PPI) (October): Tracks changes in wholesale prices, a leading indicator of inflation pressures.
Friday, November 15, 2024
- US Industrial Production (October): Measures the output of factories, mines, and utilities.
- US Retail Sales (October): Reflects consumer spending, a major component of economic activity.
This calendar covers the main economic indicators for the UK and US during this period, which are closely watched for their implications on the economy, market sentiment, and monetary policy decisions.
Conclusion
In conclusion, the analysis of US Treasury par rates and the trajectory of UK CPI inflation has highlighted the intricate dynamics currently at play in both economies. As global markets continue to navigate a landscape shaped by inflationary pressures and interest rate expectations, the data points we’ve discussed will remain pivotal for understanding future trends. Whether it’s the yield curve’s subtle hints or the consumer price index’s insights into inflation, staying informed on these key metrics will be crucial for any market participant.
Thank you for making it to the end of this market outlook. Your engagement is greatly appreciated, and I hope you found the insights valuable. Don’t forget to tune in for the next market outlook, set to be published on November 17th, where we will continue to explore the forces shaping the global economy. Until then, stay curious, stay informed, and thanks for reading!

Leave a comment